July 21, 2026 · Jarid Love
How to measure whether AI recommends your business

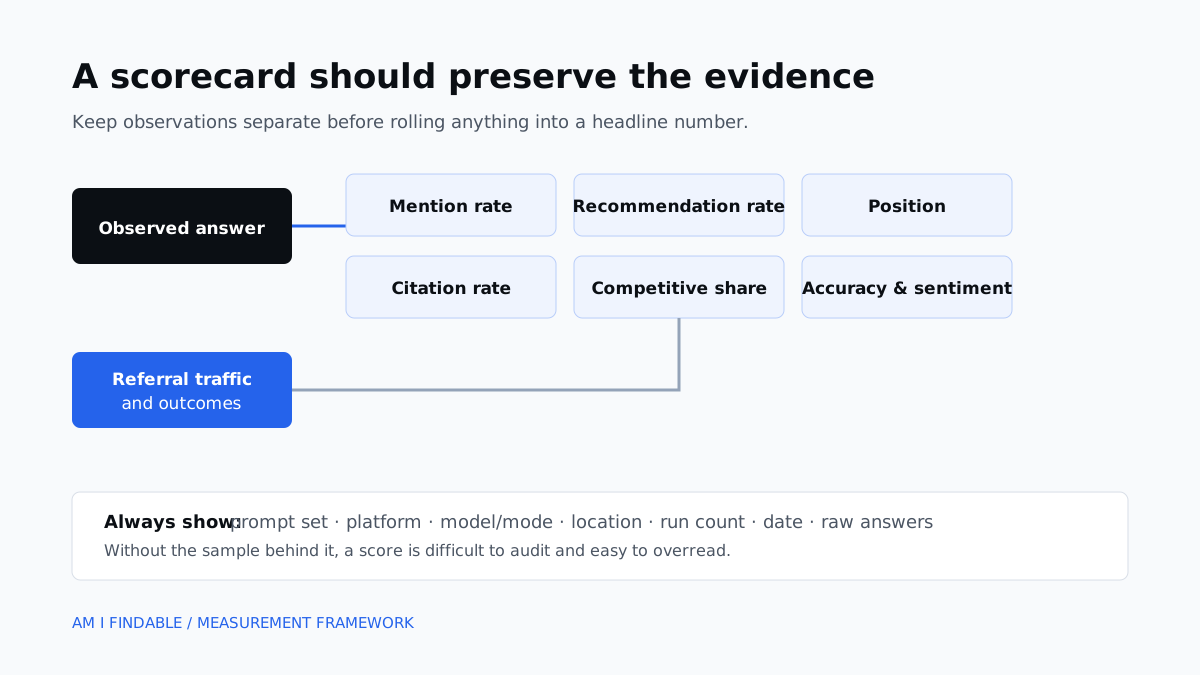
An AI visibility score compresses a complicated question into one number, so its meaning depends on the sample behind it.
No monitoring company can observe every answer ChatGPT, Claude, Gemini, or Perplexity gives to every user. A visibility report measures a defined sample: selected questions, run on selected platforms, in selected locations and modes, at selected times.
Documented clearly, that sample shows whether your business appeared for important buyer questions, which competitors appeared instead, and how the result changed over time.
Start with buyer questions, not vanity prompts
The prompt portfolio determines what the report means. If every prompt contains your brand name, the report measures prompted brand descriptions. Add unbranded category and problem questions to measure discovery.
A practical portfolio covers several stages:
| Stage | Example | What it tests |
|---|---|---|
| Discovery | “Best invoicing software for a two-person consultancy” | Unaided category inclusion |
| Comparison | “FreshBooks vs. Xero for service businesses” | Relative positioning |
| Constraint | “Accounting software that works without an accountant” | Fit for a specific need |
| Objection | “What are the drawbacks of FreshBooks?” | Accuracy and negative themes |
| Branded | “Is FreshBooks good for consultants?” | How the engine describes a known brand |
Use actual sales questions, search queries, support conversations, and customer interviews where available. Label inferred or generated prompts honestly. A model-generated question is a hypothesis about demand, not evidence that a customer asked it.
The seven metrics worth separating
1. Mention rate
Definition: the percentage of sampled answers that name the brand.
If 18 of 60 answers mention you, the mention rate is 30%.
Mention rate answers “Were we included?” Use the other metrics below to evaluate favorability, prominence, links, and persuasive strength.
2. Recommendation rate
Definition: the percentage of answers that present the brand as a suitable choice, not merely mention it.
“Acme is one option” and “Acme is the best fit for a two-person team” represent different events. Recommendation classification requires context, with ambiguous cases exposed for review.
3. Position when found
For list-style answers, record where the brand appears among named alternatives. Use this carefully. Position is meaningful when the answer is ordered; it is less meaningful in narrative prose or when different runs contain different sets of brands.
Report both coverage and position. An average position of 1.2 based on five appearances can look better than an average of 2.5 based on fifty appearances while representing much less visibility.
4. Citation rate and citation share
A citation is a linked source; a brand mention is an appearance in the answer text. Track each separately.
In a study published June 9, 2026, Semrush and Kevin Indig analyzed 3,981 domain appearances produced by 115 prompts across 14 countries and four engines. They classified 62% of citations as “ghost citations”: the answer linked the domain without naming the brand. Within the same sample, ChatGPT cited domains in 87% of appearances but named brands in 20.7%; Gemini named brands in 83.7% of appearances but cited them in 21.4%.
A reader can encounter an answer that uses your page as a source and still finish without learning that your business exists. Keep mentions and citations separate so the report preserves that difference.
Track:
- answers linking to your domain;
- total citations to your domain;
- cited pages;
- owned versus third-party sources;
- citations attached to passages that actually concern your brand.
5. Competitive share of voice
Share of voice compares brand appearances within the same prompt portfolio.
State the denominator: your share of all brand mentions, all answers, or all recommendation slots. Each answers a different question.
Competitors should be relevant to the question, not merely the companies entered during onboarding. AI answers often reveal an unexpected competitor set worth reviewing.
6. Sentiment and factual accuracy
Sentiment asks whether the language is positive, neutral, mixed, or negative. Accuracy asks whether specific claims are correct.
Keep them separate. A positive statement can be factually wrong; a negative statement can be accurate and useful.
For high-impact facts such as pricing, availability, eligibility, safety, location, and integrations, show the original answer for human verification alongside any sentiment score.
7. Referral traffic and outcomes
Referral sessions from AI platforms are observable when links carry usable referrer information or tracking parameters. They are the closest metric to conventional acquisition.
Referral data captures only visits that preserve usable attribution. A person may see the brand in an AI answer and visit later through search, direct navigation, or another device. Record that as possible influence when supporting evidence exists.
Measure conversions from known AI referrals, assisted conversions where the evidence supports them, and qualitative “How did you hear about us?” responses. Never turn modeled visibility into claimed revenue.
Why platform totals should not be blended blindly
Different engines retrieve from different source pools and expose citations differently. Even modes within one product can behave like different search systems.
A portfolio score can help summarize performance, but every summary needs a platform breakdown. Otherwise an improvement on one engine can mask a decline on another, and an engine that returns more citations can dominate the aggregate.
Whatever tool you use, ours included, hold its report to this checklist. If the report cannot answer these questions, you cannot compare it reliably with last month’s result:
- Which platforms and modes were included?
- How many prompts were tested on each platform?
- How many runs were completed for each prompt?
- Which locale and language settings were used?
- When were the answers collected?
- How were platforms, prompts, and runs weighted in the final score?
- Which runs failed or returned no usable answer?
If a tool omits failed runs, its best-looking score may also be its least representative one.
How many prompts and runs are enough?
Sample size depends on how many distinct buying situations matter and how much precision the decision requires. A local plumber can use a smaller portfolio than a multinational software suite.
Use this practical rule:
- Cover every materially different buyer intent.
- Add questions until new prompts stop revealing new competitors and themes.
- Repeat high-value prompts enough to expose obvious answer variance.
- Show the sample size beside every percentage.
- Treat small changes as noise until they persist across runs or periods.
Ten prompts can produce a useful snapshot. Precise market-share claims require broader samples, and every sample still needs a balanced prompt set.
Establish a reporting rhythm
Weekly: operational checks
Review critical prompt failures, incorrect facts, new negative claims, crawler access, and sudden source changes. Avoid rewriting strategy around a one-week wobble.
Monthly: comparable trend
Run the stable core portfolio using the same settings. Compare mention rate, recommendation rate, citations, source mix, and competitors. Annotate meaningful site, content, PR, or product changes.
Quarterly: portfolio review
Update prompts to reflect new products, questions, competitors, and customer language. Keep a stable subset so the trend remains comparable. A changing market requires a changing portfolio; a valid time series requires some continuity.
A one-page scorecard
Every executive report should fit these questions on one page:
- What did we test?
- How often were we mentioned and recommended?
- Which competitors appeared more often?
- What did the engines say incorrectly?
- Which owned and third-party pages were cited?
- What changed beyond ordinary run-to-run variation?
- What are the next three actions, and what evidence supports them?
The appendix can contain every answer and citation. The scorecard should make the decision clear without hiding the sample.
What a trustworthy score tells you
A visibility score tells you whether your business appeared for the questions you track, how that changed since the previous measurement, and which competitors appeared instead. Those findings give you something concrete to investigate and improve.
The score covers the recorded sample. Claims about an engine’s internal formula, causation, total audience reach, or every private conversation require additional evidence. The first boundary tells you what to act on; the second keeps the result credible.
Next: confirm that the platforms you are measuring can crawl and retrieve the important parts of your website.